Never thought I would start seeing so many unresolved city problems – and never thought highly-informative classes can be delivered in as little as 42 hours
Probably the most intense class I took, but also the most informative. It was all about getting ourselves familiar with wayfinding and signage design, while tackling the obvious problems of Rovaniemi, a greatly poor wayfinding system for tourists. One thing I noticed about the education here is that it almost never only involves sitting on a chair while being lectured by the professor.
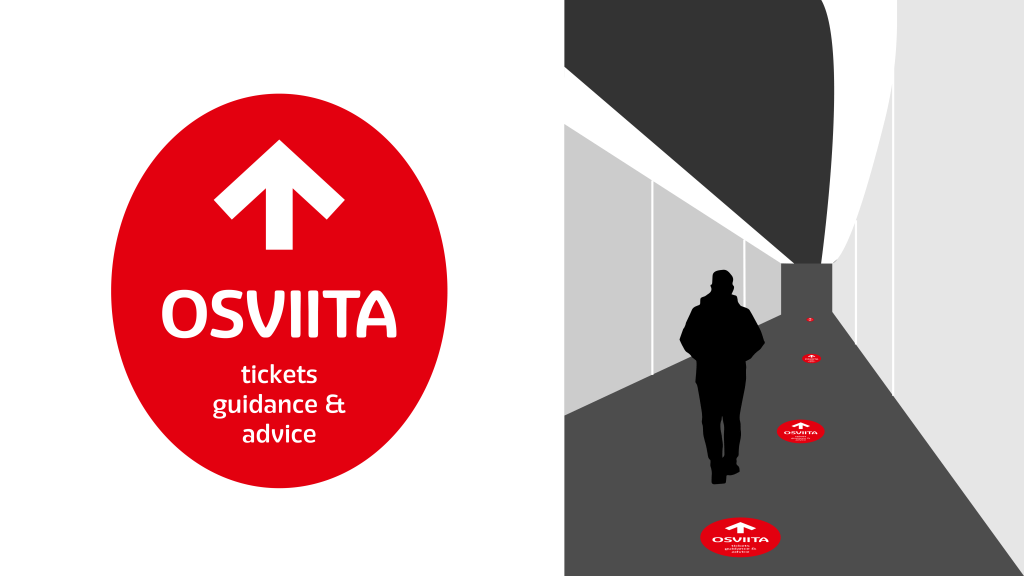
One of the days, the teacher took the whole class out in the city centre and divided us into groups. We were given tasks to resolve around the city, things as simple as finding out where the tickets for a future weekend concert are being sold, finding the way to a memorial statue, or orienting ourselves by using the city maps. Only this one day unveiled a truth that would have never been found were we behind a table in a classroom with a slideshow in from of us. This city needed serious help in creating a sense of orientation.
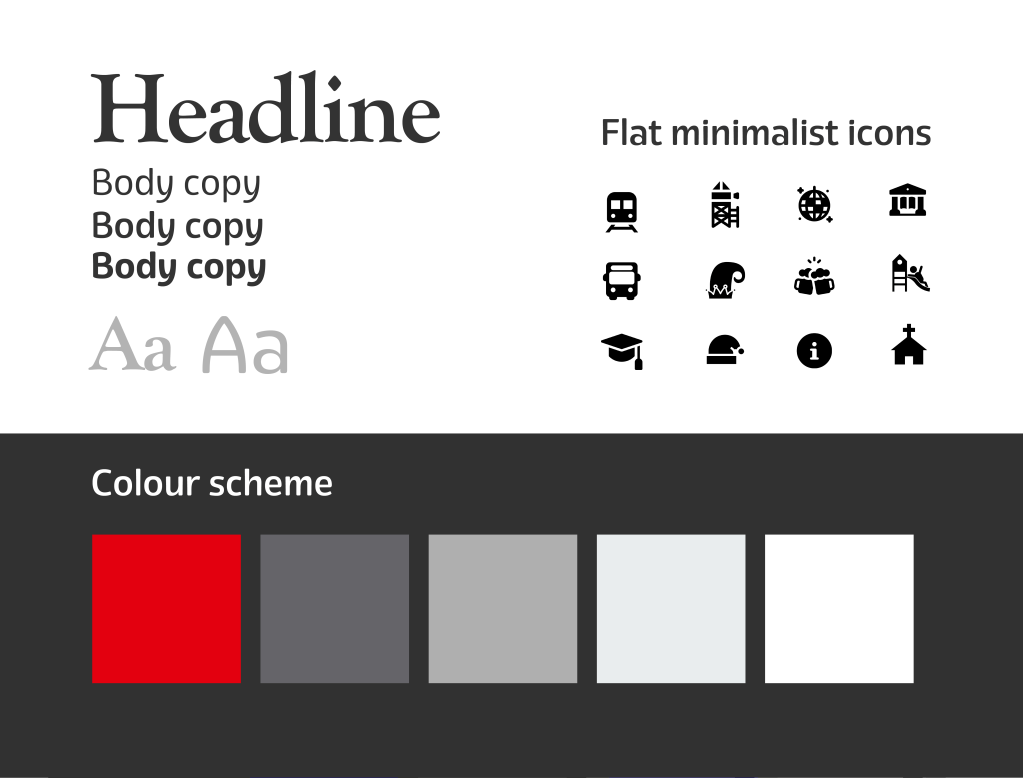
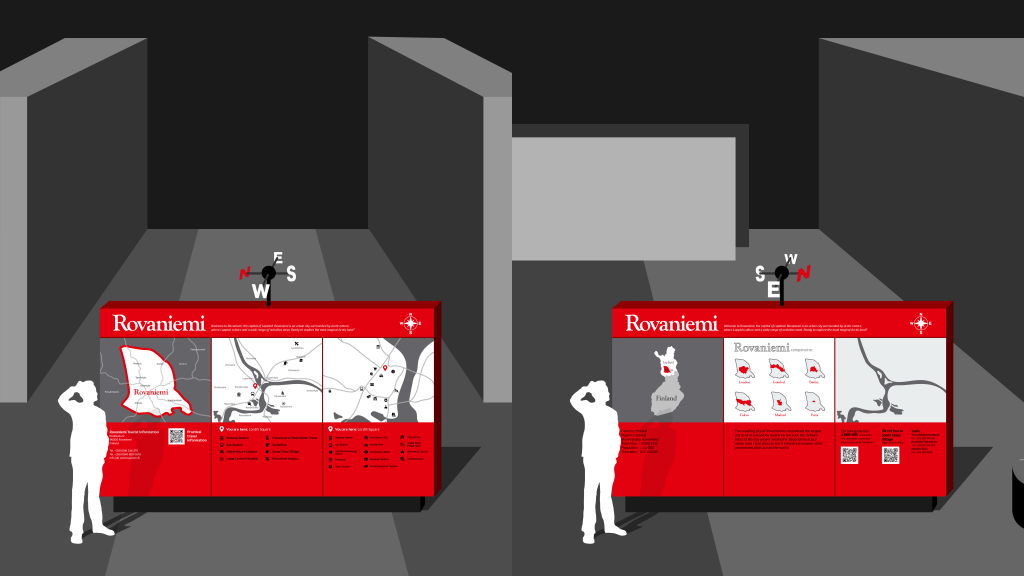
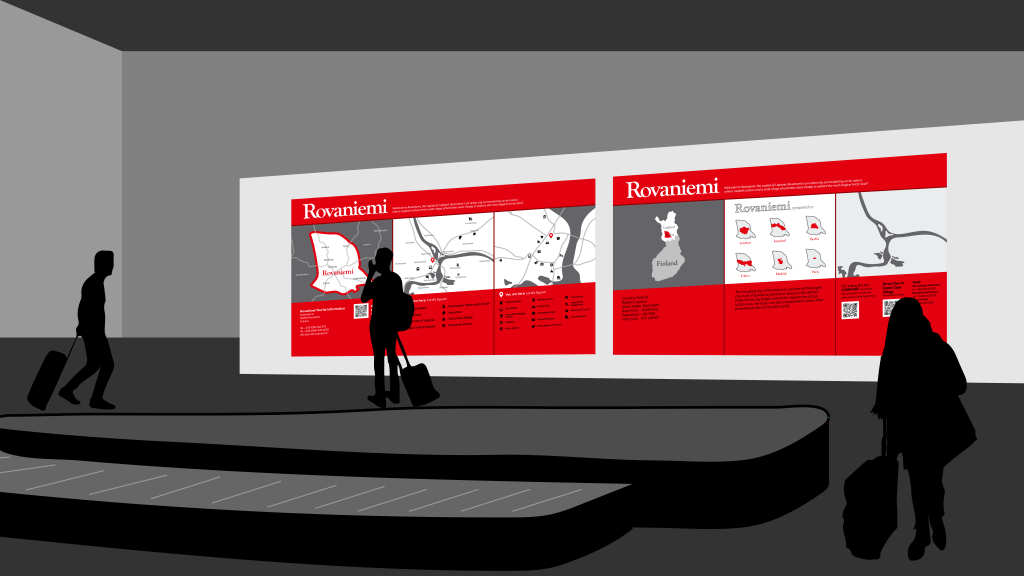
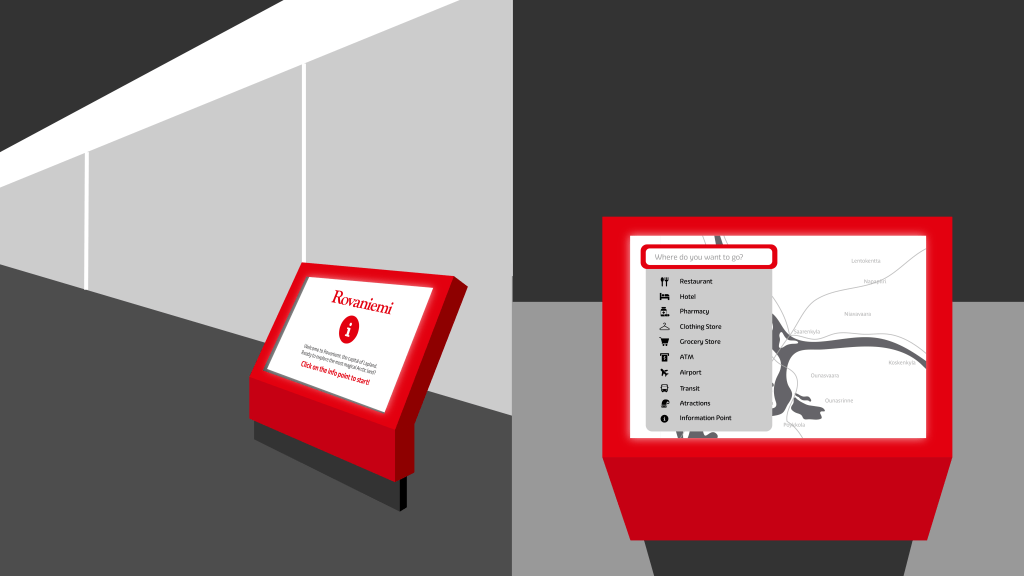
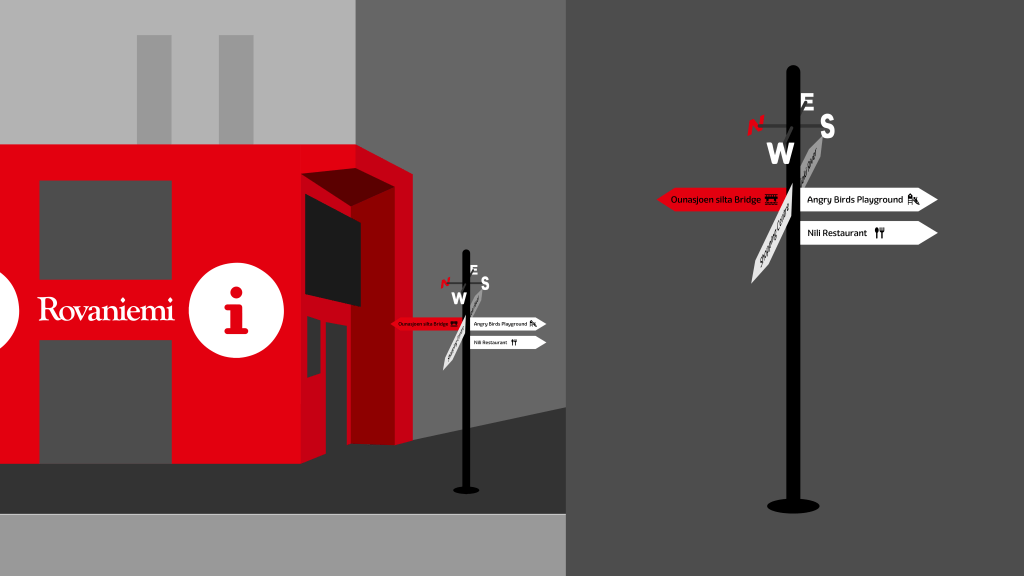
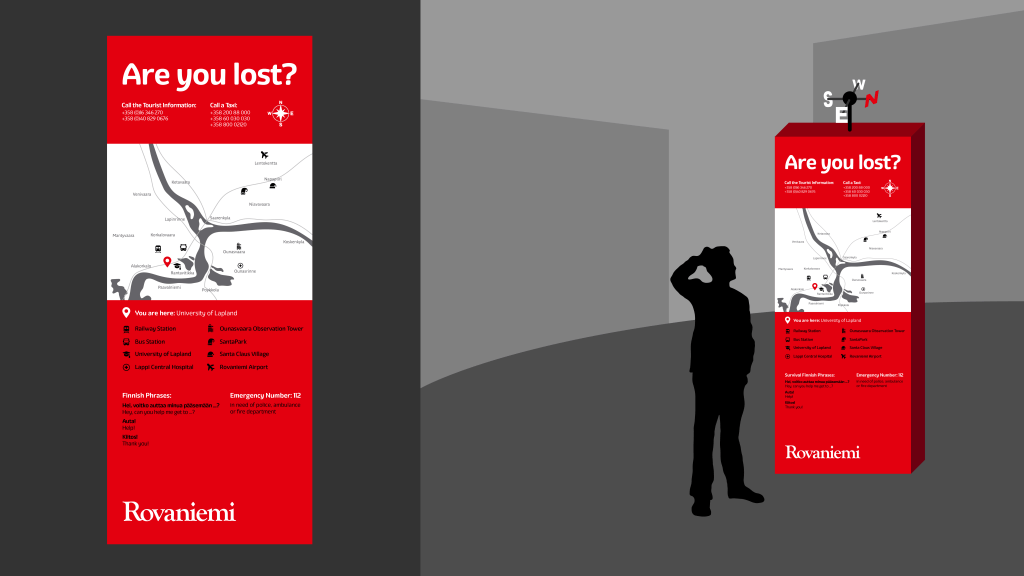
The goal here was to design a signage system that would help tourists locate themselves and their surroundings not only by using Google Maps. A very thorough research was needed and by applying the rules of intention, target audience mapping and KISS (keep it simple stupid), I achieved the level of problem-solving design that I was aimimg for, delivering a presentation backed by reason, evidence, reflection, ideation and prototypes.
the ideal signage system is the one which doesn’t need any signs, i wish it could access one’s brain directly
masaaki hiromura

Valuable learning points from the lectures
- Otl Aicher – prominent German graphic designer – known for the Munich Summer Olympic 1972 visuals
- Yoshiro Yamashita – designed the first set of pictograms for the Tokyo Olympic Games 1964
- “Ryman Eco” – eco-friendly typeface – ink reduction of 30%
- Vinyl cutting demonstration on signage creation
- 4-step creative process:
- preparation
- incubation
- brainstorm
- refine & produce
- ISO 7001 – “public information symbols” – published by the International Organization for Standardization – defines a set of pictograms and symbols for public information
- DOT pictograms – set of pictograms to be used throughout public transport networks – by the US Department of Transportation
- 10-step planning process:
- define the problem
- compose the team
- gather the information
- analyse data – UX
- develop a strategy
- plan signage
- design graphics
- design hardware
- implement the plan
- evaluate results
- The Kitasenju Pictograms – hurdling the language barrier
- conspicuity index = visibility of the sign based on its background
- “This is Strawberry Red” project in Japan – mural from 40 kg of strawberries
- “WHAT MADE ME” designed by Dorota Grabkowska – installation created to provide an interactive experience
- “All I Really Need to Know I Learned in Kindergarten” – book by Robert Fulghum on world improvement if adults adhered to the same basic rules as children
Good art inspires. good design motivates.
Otl aicher

Leave a comment